I've spoken in the past about prioritized patching and the operational constraints. Assuming you actually want to do some prioritization, how do you go about it?
Continuing in the data-driven security realm, I've been pushing my vulnerability management tools to their limit. One of the tools we use is Nessus for internal vulnerability scanning. I've been a Nessus fan since Y2K days and still love it now. One problem with all vulnerability scanners (and reports) is that their risk ranking tools are clunky, sometime inappropriate, and occasionally over-inflated.
Most of them use CVSS, which is a nice standard though quite limited. And do remember, "Vulnerability != risk." As you may have read before, I do a wide variety of types of internal vulnerability scanning and then synthesize the results.
What I want to do is suck up and analyze all this scanning data, and then apply localized relevant data, and then put this through a risk model of my own choosing. There is really no such beast, though some commercial services are very close and becoming quite useful. And this open source tool is also pretty good too.
So in the spirit of "Make your own security tools", I started working on risk scoring tool to use with Nessus and some of my other in-house scanning tools.
I wish I could share code with you, but this is developed on my employer's dime and is used internally... so no. The good news, it wasn't hard to do and I think I can walk you through the algorithm and the heavy lifting.
Let's start with the Nessus data itself. You can export everything you need in a handy XML file which can be read natively by a variety of tools.


The information about the scan gives me when the scan was done (so I can save and compare subsequent scans) as well as which vulnerabilities were tested. This is critical because I can see what hosts were tested for what. Then I can mark off a vulnerability that was previously found when it no longer shows up (it was fixed!). I can also get data about the vulnerability itself, such as when it was discovered. This is useful in my risk model because we've seen that old vulnerabilities are worse than new ones. I also get from Nessus whether a public exploit is available for that vulnerability... and that info is in the exported XML for the scooping. This is extremely valuable for risk modelling, as these kinds of vulnerabilities have been shown to be far more worrisome.
After I pull in the data, I need to store it since I'm looking at synthesizing multiple scans from different sources. So I shove all of this into a local database. I've chosen SQLite just because I've used it before and easy. Having been a former database developer, I know a little bit about data normalization. So here's the structure I'm using for now.


The second piece is to run risk modelling and generate reports in CSV format, suitable for spreadsheeting. Here's what pops out:

Oh yeah, you can see I'm calling the thing Cestus. Anyway, I produce two reports, one is a host/services report, which is a nice running tally of inventory of hosts and services. This has obvious utility beyond security and since I have all the info, why not grab it and analyze it?

Second report is the meat: my synthesized list of vulnerabilities and risk scoring.

Now, how do I calculate the "risk"? Well, that's the beauty of doing this myself. Answer: anyway I want. Let's build an arbitrary risk model for scoring vulnerabilities to illustrate:
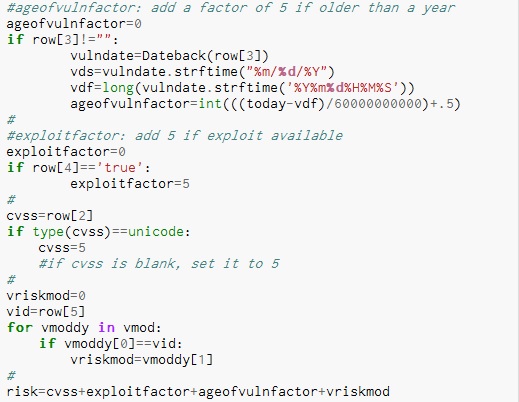
Alright, we'll use CVSS as the base score. If there's no CVSS score for a particular discovered vulnerability, then just pick 5 (right in the middle). Now add to it based on the vulnerability's age.... the older, the higher (again arbitrary weights at this point). Add 5 more points if there's a known exploit. I also have another table of vulnerabilities with their own weight factors to tweak this.

I use this to add or subtract from the risk score based on what I may know about a particular vulnerability in our environment. For example, An open SMB share rates high but I'm doing a credentialed scan, so actually the share is locked down. Drop the score by... I dunno... 6. Add this up, and now we've got some risk scores, which I when I open the CSV in Excel, I can quickly sort on.

This is a nice quick way at looking at things. As you may have guessed, this is only step 1 (actually step 2) in my plan. The next step is link this to my intrusion dashboard so I can have company-specific threat intelligence feeding my risk models. I also would like to add more external vulnerability scanning sources and feeds into my risk modelling calculator. Of course, I'll want to improve and test my risk model against the real world, see how it performs. When I get that all working, maybe I'll blog about it.
1 comment:
Wonderful website. Lots of useful information here. I’m sending it to some friends. I would like to see extra posts like this.
Post a Comment